
Ethereum Statistics (2022)
Written by Alchemy
Overall, the Ethereum blockchain had a substantial amount of activity in Q1 2022, whether it be from NFTs, DeFi, or Layer 2 scaling solutions.
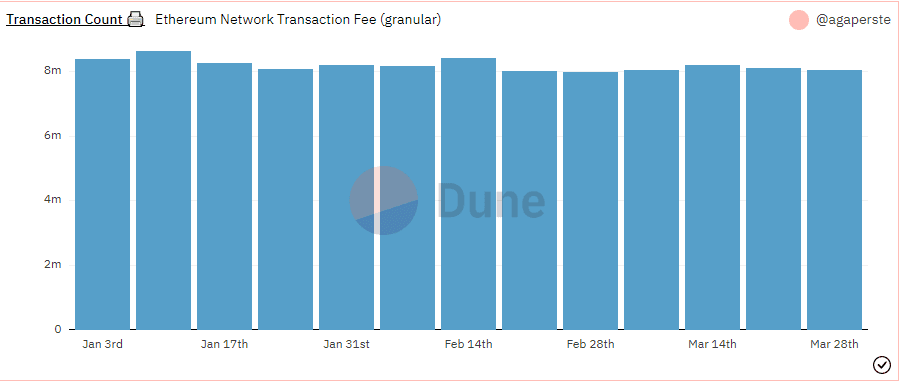
How many Ethereum transactions are there?
The total number of transactions in Q1 2022 was 105.58 million. Compared to the 116.16 million transactions in Q4 2021, that represents a decrease of 9.1%.
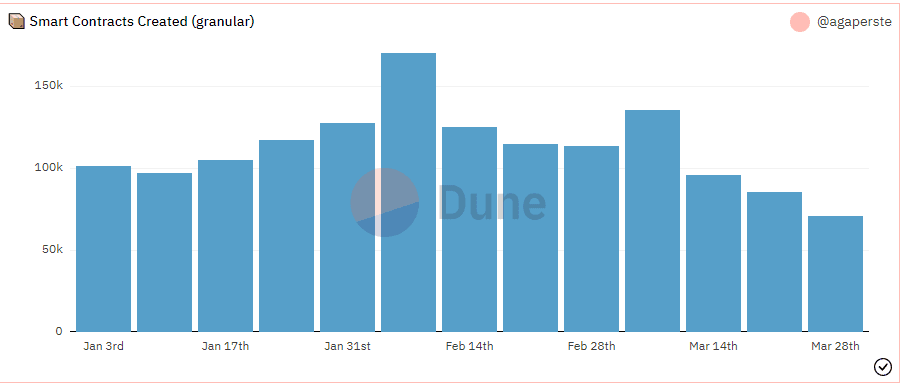
How many Ethereum smart contracts are there?
The total number of smart contracts created in Q1 2022 was 1.45 million smart contracts.
This is a 24.7% increase in comparison to the total smart contracts created in the fourth quarter of 2021, which was 1.16 million.
The crypto market cap in Q1 2022 was down compared to Q4 2021, but the number of smart contracts that were created during this period points to an increase in development activity despite less transaction volume.
How much is the average daily Ethereum gas fee?
The average transaction fee in Q1 2022 was 0.0079 ETH, or $16.75. Compared to a Q4 2021 transaction fee of 0.0090 ETH, or $19.10, this represents a 12.2% net decrease.
With much of Q1 spent in a down market, one reason why the average gas price is down is that there is less on-chain activity occurring in Q1, which influences the cost to send a transaction.
How many daily active Ethereum addresses are there?
The number of average daily active addresses in Q1 2022 was 329,900. Compared to 400,040 in Q4 2021, that’s a 17.5% decrease. There was a noticeable increase in activity towards the end of the quarter in late February and March.
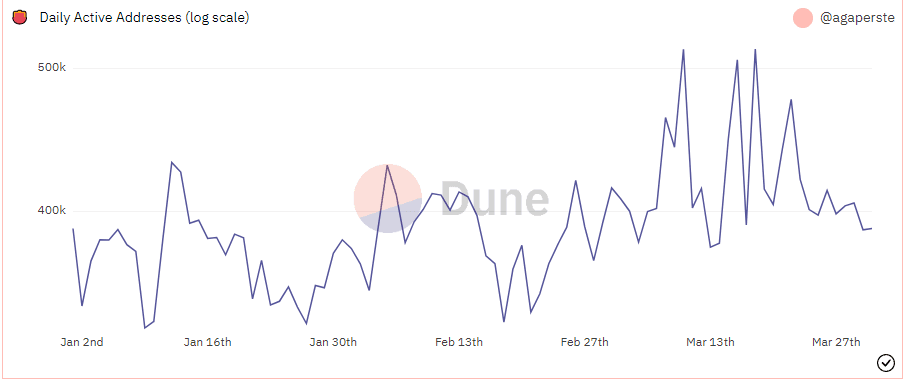
When markets correct, it is typical that the total number of wallets actively trading crypto, NFTs, and participating in the blockchain gaming sector decreases to reflect changing sentiments.
How much is the total value locked (TVL) for Ethereum DeFi?

The DeFi TVL was $89.5 billion in Q1 2022. Compared to $154.2 billion in Q4 2021, that’s an approximate decrease in volume of 42%.
This significant decrease in TVL is likely a response to a market-wide correction, or selloff, where prices have dipped. Typically this leads people to unlock their assets so they can have more flexibility during uncertain market conditions.
How much is ethereum’s revenue?
The Ethereum network’s revenue in Q1 2022 was 834,874 ETH or around 1.679 billion dollars. Compared to 2.105 billion dollars in Q4 2021, that’s around a 20.2% decrease. This means there was a decrease in revenue for miners, who earn the vast majority of ETH Network revenue.

How much ETH was burned?
A total of 728,729 ETH or around 1.671 billion dollars was burned in Q1 2022. This means that all of these tokens were permanently removed from circulation, reducing the overall supply.

How much ETH is mined?
A total of 404,657 ETH or around 928 million dollars were mined in Q1 2022.

What percentage of Ethereum transactions are EIP-1559?
Around 77.2% of all Ethereum transactions in Q1 2022 were EIP-1559 transactions (Type 2 transactions) compared to Type 0 transactions which use the original gas fee structure.

How many beacon chain validators are there on Ethereum?
There were 341,123 validators in Q1 2022. Compared to 275,830 validators in Q4 2021, this represents a 23.7% increase in the total number of Ethereum Beacon Chain validators.
With the Ethereum Proof-of-Stake merge approaching later in 2022, we are seeing an increased number of validators joining the Ethereum Beacon chain to help secure the new PoS network.

How much do beacon chain validators earn?
The average daily income across all validators in Q1 2022 was around 1.5k ETH. Compared to 1.4k ETH last quarter, that’s around a 7.1% increase. With more Beacon chain validators joining the network, the total income each validator earns is decreasing.

What are the top Ethereum projects by total transactions?
The top Ethereum projects by total number of transactions last quarter were OpenSea, Uniswap, Coinbase, 0x, StrongNode, Polygon, and LooksRare. All of these top Ethereum projects saw over 1 million transactions with OpenSea topping the list with 7,840,000 million transactions in Q1 2022.
Rank | Project | # of Tx |
|---|---|---|
1 | opensea | 7.84m |
2 | tether | 6.01m |
3 | uniswap_v3 | 3.92m |
4 | coinbase | 2.78m |
5 | zeroex | 2.56m |
6 | strong | 1.17m |
7 | polygon | 1.15m |
8 | uniswap_v2 | 1.12m |
9 | looksrare | 1.01m |
10 | ethichub | 926.33k |
NFT marketplaces and DEXs see continued growth
Compared to 4.85 million in Q4 2021, Opensea, the leading NFT marketplace, demonstrated a 61.6% increase in the total number of transactions, a signal for increasing interest in NFTs (non-fungible tokens), which were one of the largest trends in Q1 2022.
This increase in NFT activity is corroborated by the sudden rise of Looksrare, a new NFT marketplace, which jumped to the top 10 of NFT marketplaces this quarter, with over one million transactions.
Another notable trend was an increase in volume in decentralized exchanges (DEXs) like Uniswap v3, which went from 2.73 million transactions in Q4 2021 to 3.92 million in Q1 2022, a 43.6% increase.
Conclusion
While general price action for Ethereum underwent a market correction, the total developer activity and transaction volume for consumer-facing dApps like NFT marketplaces and DEXs continues to show consistent growth.
Overall, the on-chain metrics point to a resilient network of builders, creatives, and users despite market sell-offs for the underlying native cryptocurrency tokens.
In general, each subsequent quarter shows a substantial increase in both interest and innovation on the Ethereum blockchain. We expect this trend to continue as more and more developers start working on blockchain development projects and continue to develop more utility for the Ethereum blockchain, irrespective of market conditions.
Sign up for a free Alchemy account to start developing on Ethereum.
Related Overviews


Build blockchain magic
Alchemy combines the most powerful web3 developer products and tools with resources, community and legendary support.