The Tenderly integration is available for customers on paying tiers (e.g. PAYG or Enterprise).
The Transaction Lifecycle Dashboard integrates with Tenderly to give you EVM-level visibility into failed Wallet API transactions. You can debug onchain reverts by opening the Tenderly debugger, or simulate offchain failures using Tenderly's Simulator UI to replay the user operation and inspect the execution trace.
Two buttons appear in the transaction detail panel depending on the type of failure:
- Debug: Opens the Tenderly transaction debugger for onchain failures that already have a transaction hash
- Simulate: Runs a Tenderly simulation for offchain failures where the user operation was rejected before reaching the network
- An Alchemy account on a paying tier (PAYG or Enterprise)
- A transaction that failed through the Wallet API on a supported network
- A free Tenderly account to access the full debugger interface (the simulation link is public, but the full debugger requires a Tenderly login)
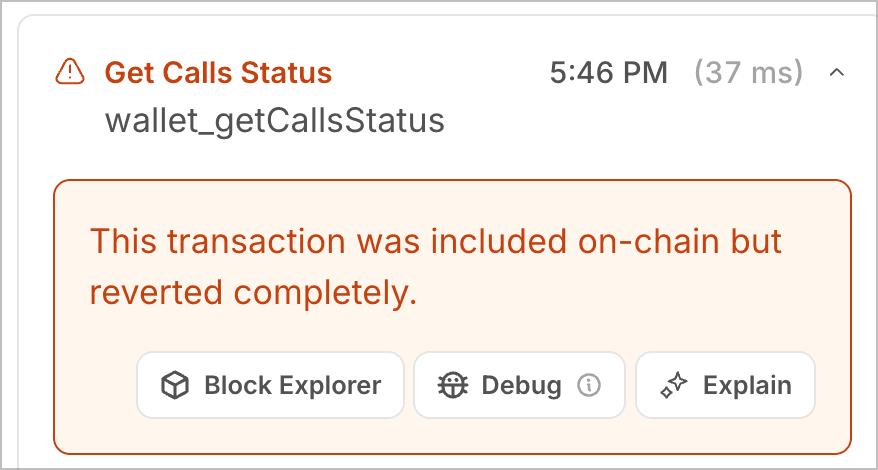
When a transaction is included onchain but reverts (status: Onchain Failure or Partial Failure), the Debug button appears in the detail panel. This applies to transactions where the bundler submitted the user operation, it was mined, but execution reverted during the inner call.
- The transaction reverted with a generic
execution revertedand no reason string — the debugger shows exactly which nested call failed and why. - A third-party contract (a DEX, NFT marketplace, or lending protocol) reverted with a custom error — the debugger decodes the function call, inputs, and the exact point of failure.
- A batched transaction with multiple calls reverted, and you need to identify which call in the batch caused the revert.
Open the Transaction Lifecycle Dashboard and filter by Onchain Failure or Partial Failure status. Select the failed transaction to open the detail panel.
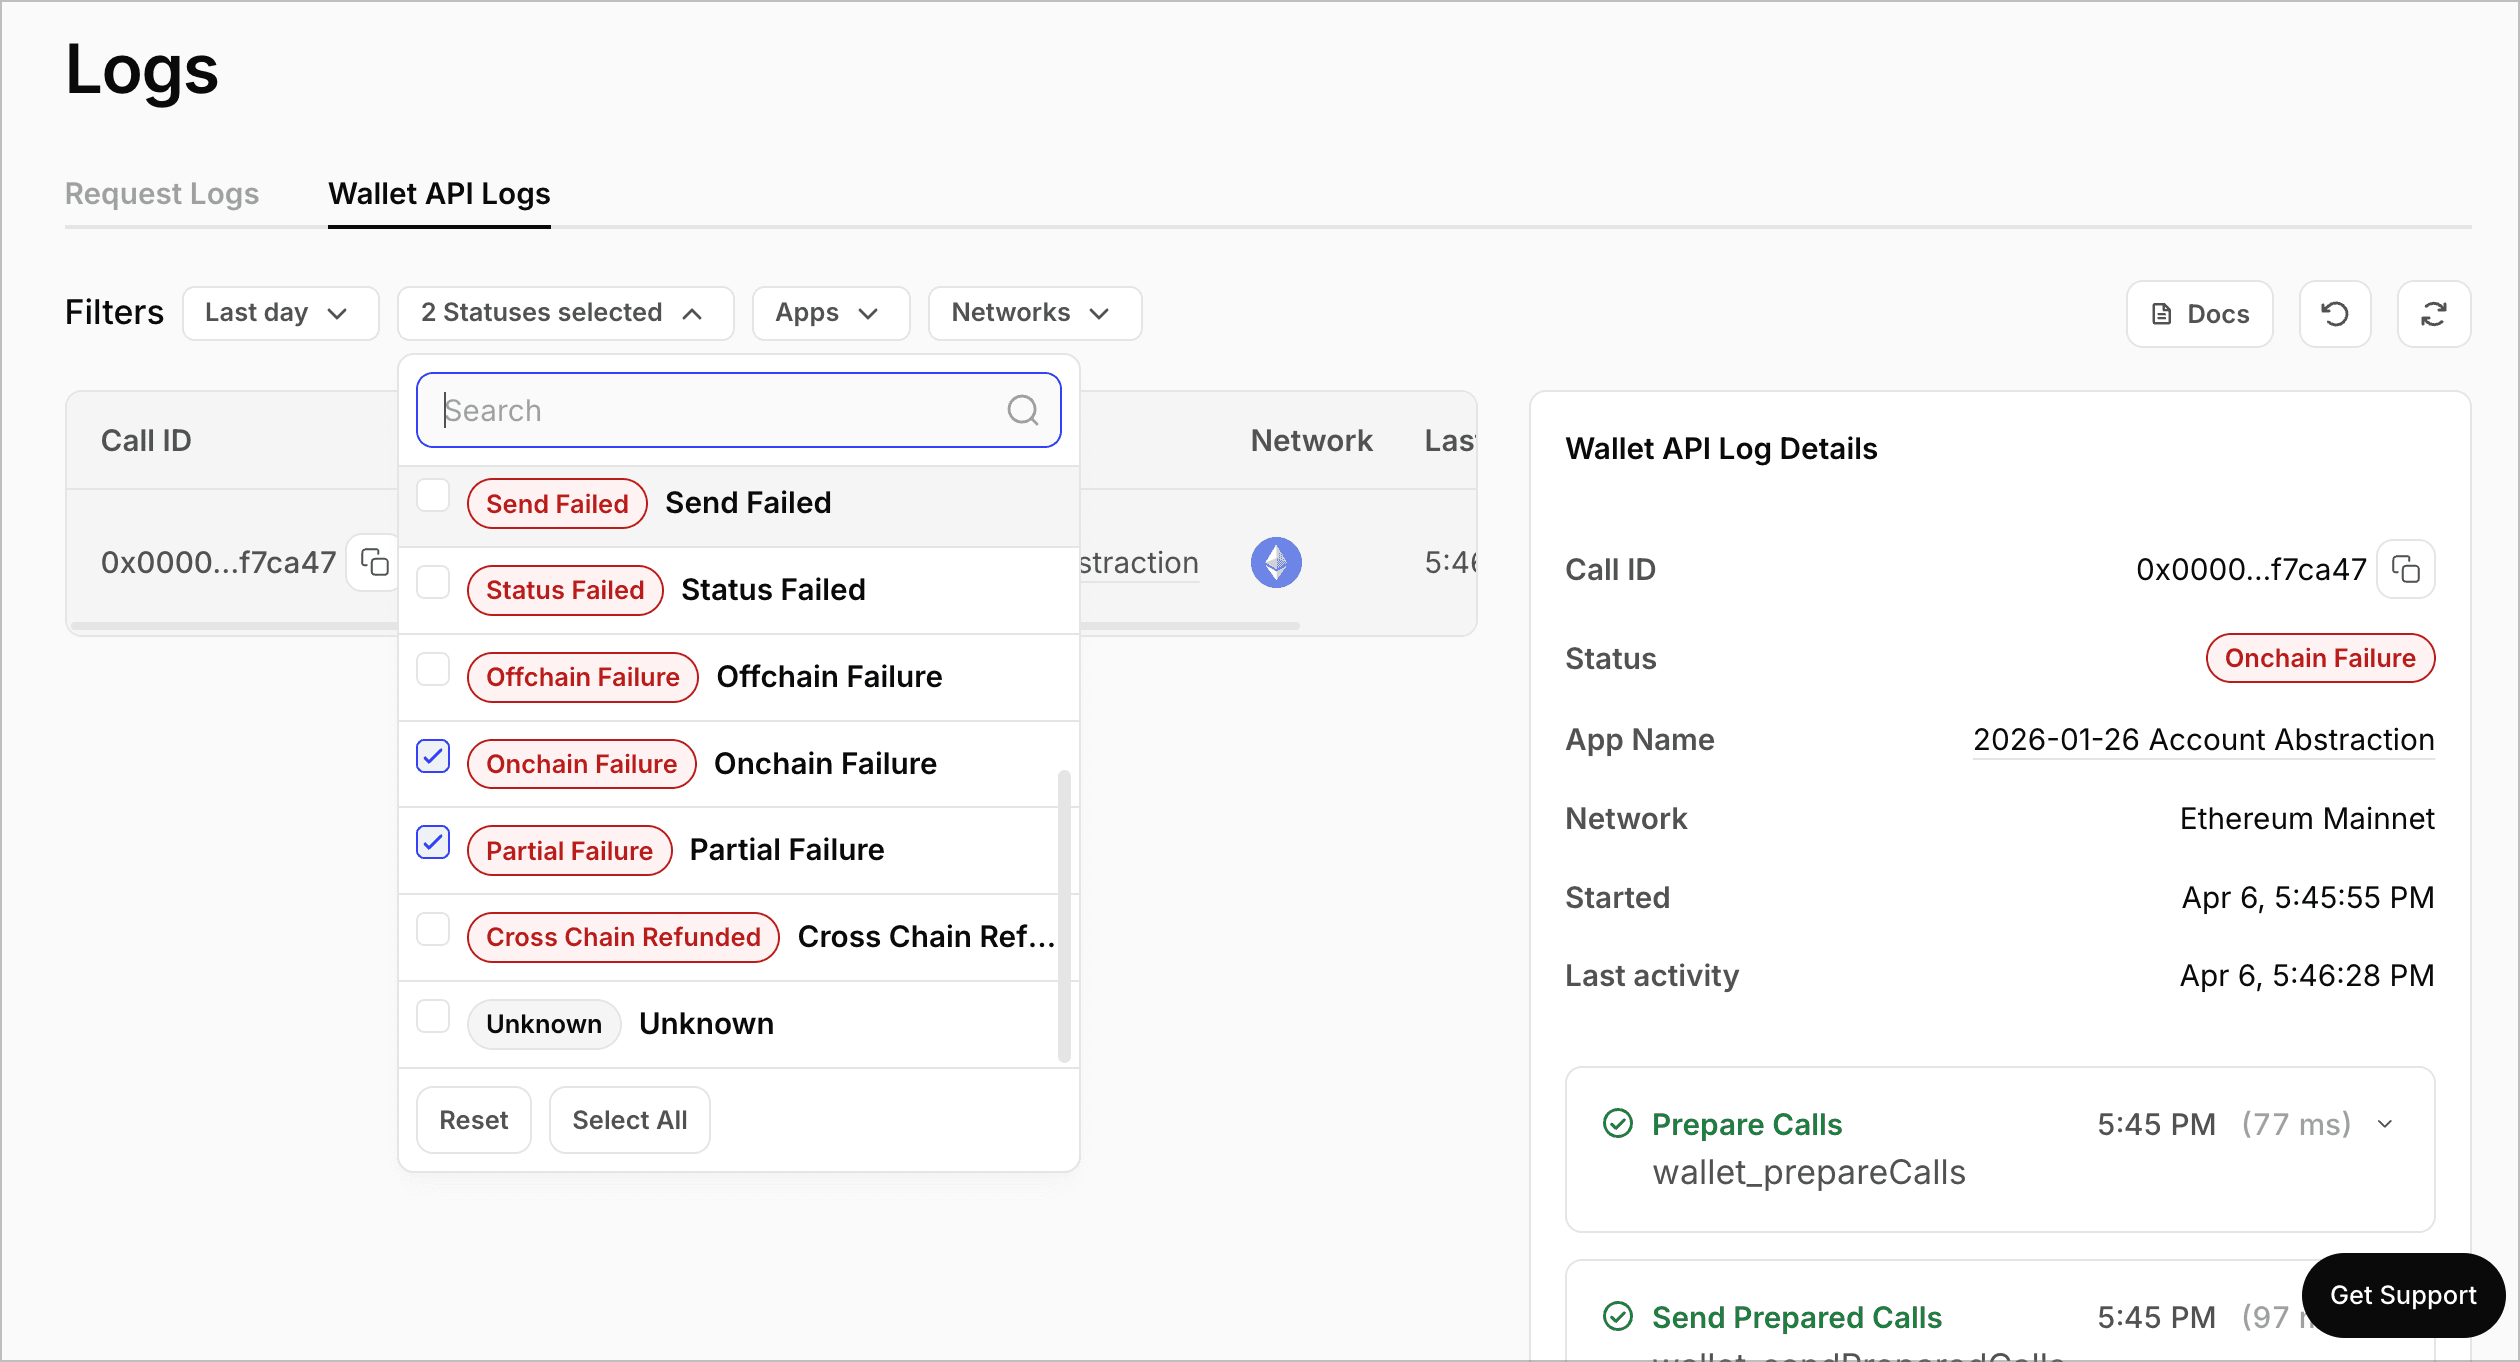
In the detail panel, locate the Debug button next to the failed step. The button only appears when the event has a transaction hash on a supported Tenderly network.
Clicking Debug opens the Tenderly Debugger for that transaction in a new tab. From there you can:
- Walk through the execution trace to see every call made during the transaction
- Inspect state changes to see how storage slots were modified
- View the decoded call information (function name, inputs, outputs, gas usage) for each step
- Identify the exact line of Solidity code where the revert occurred
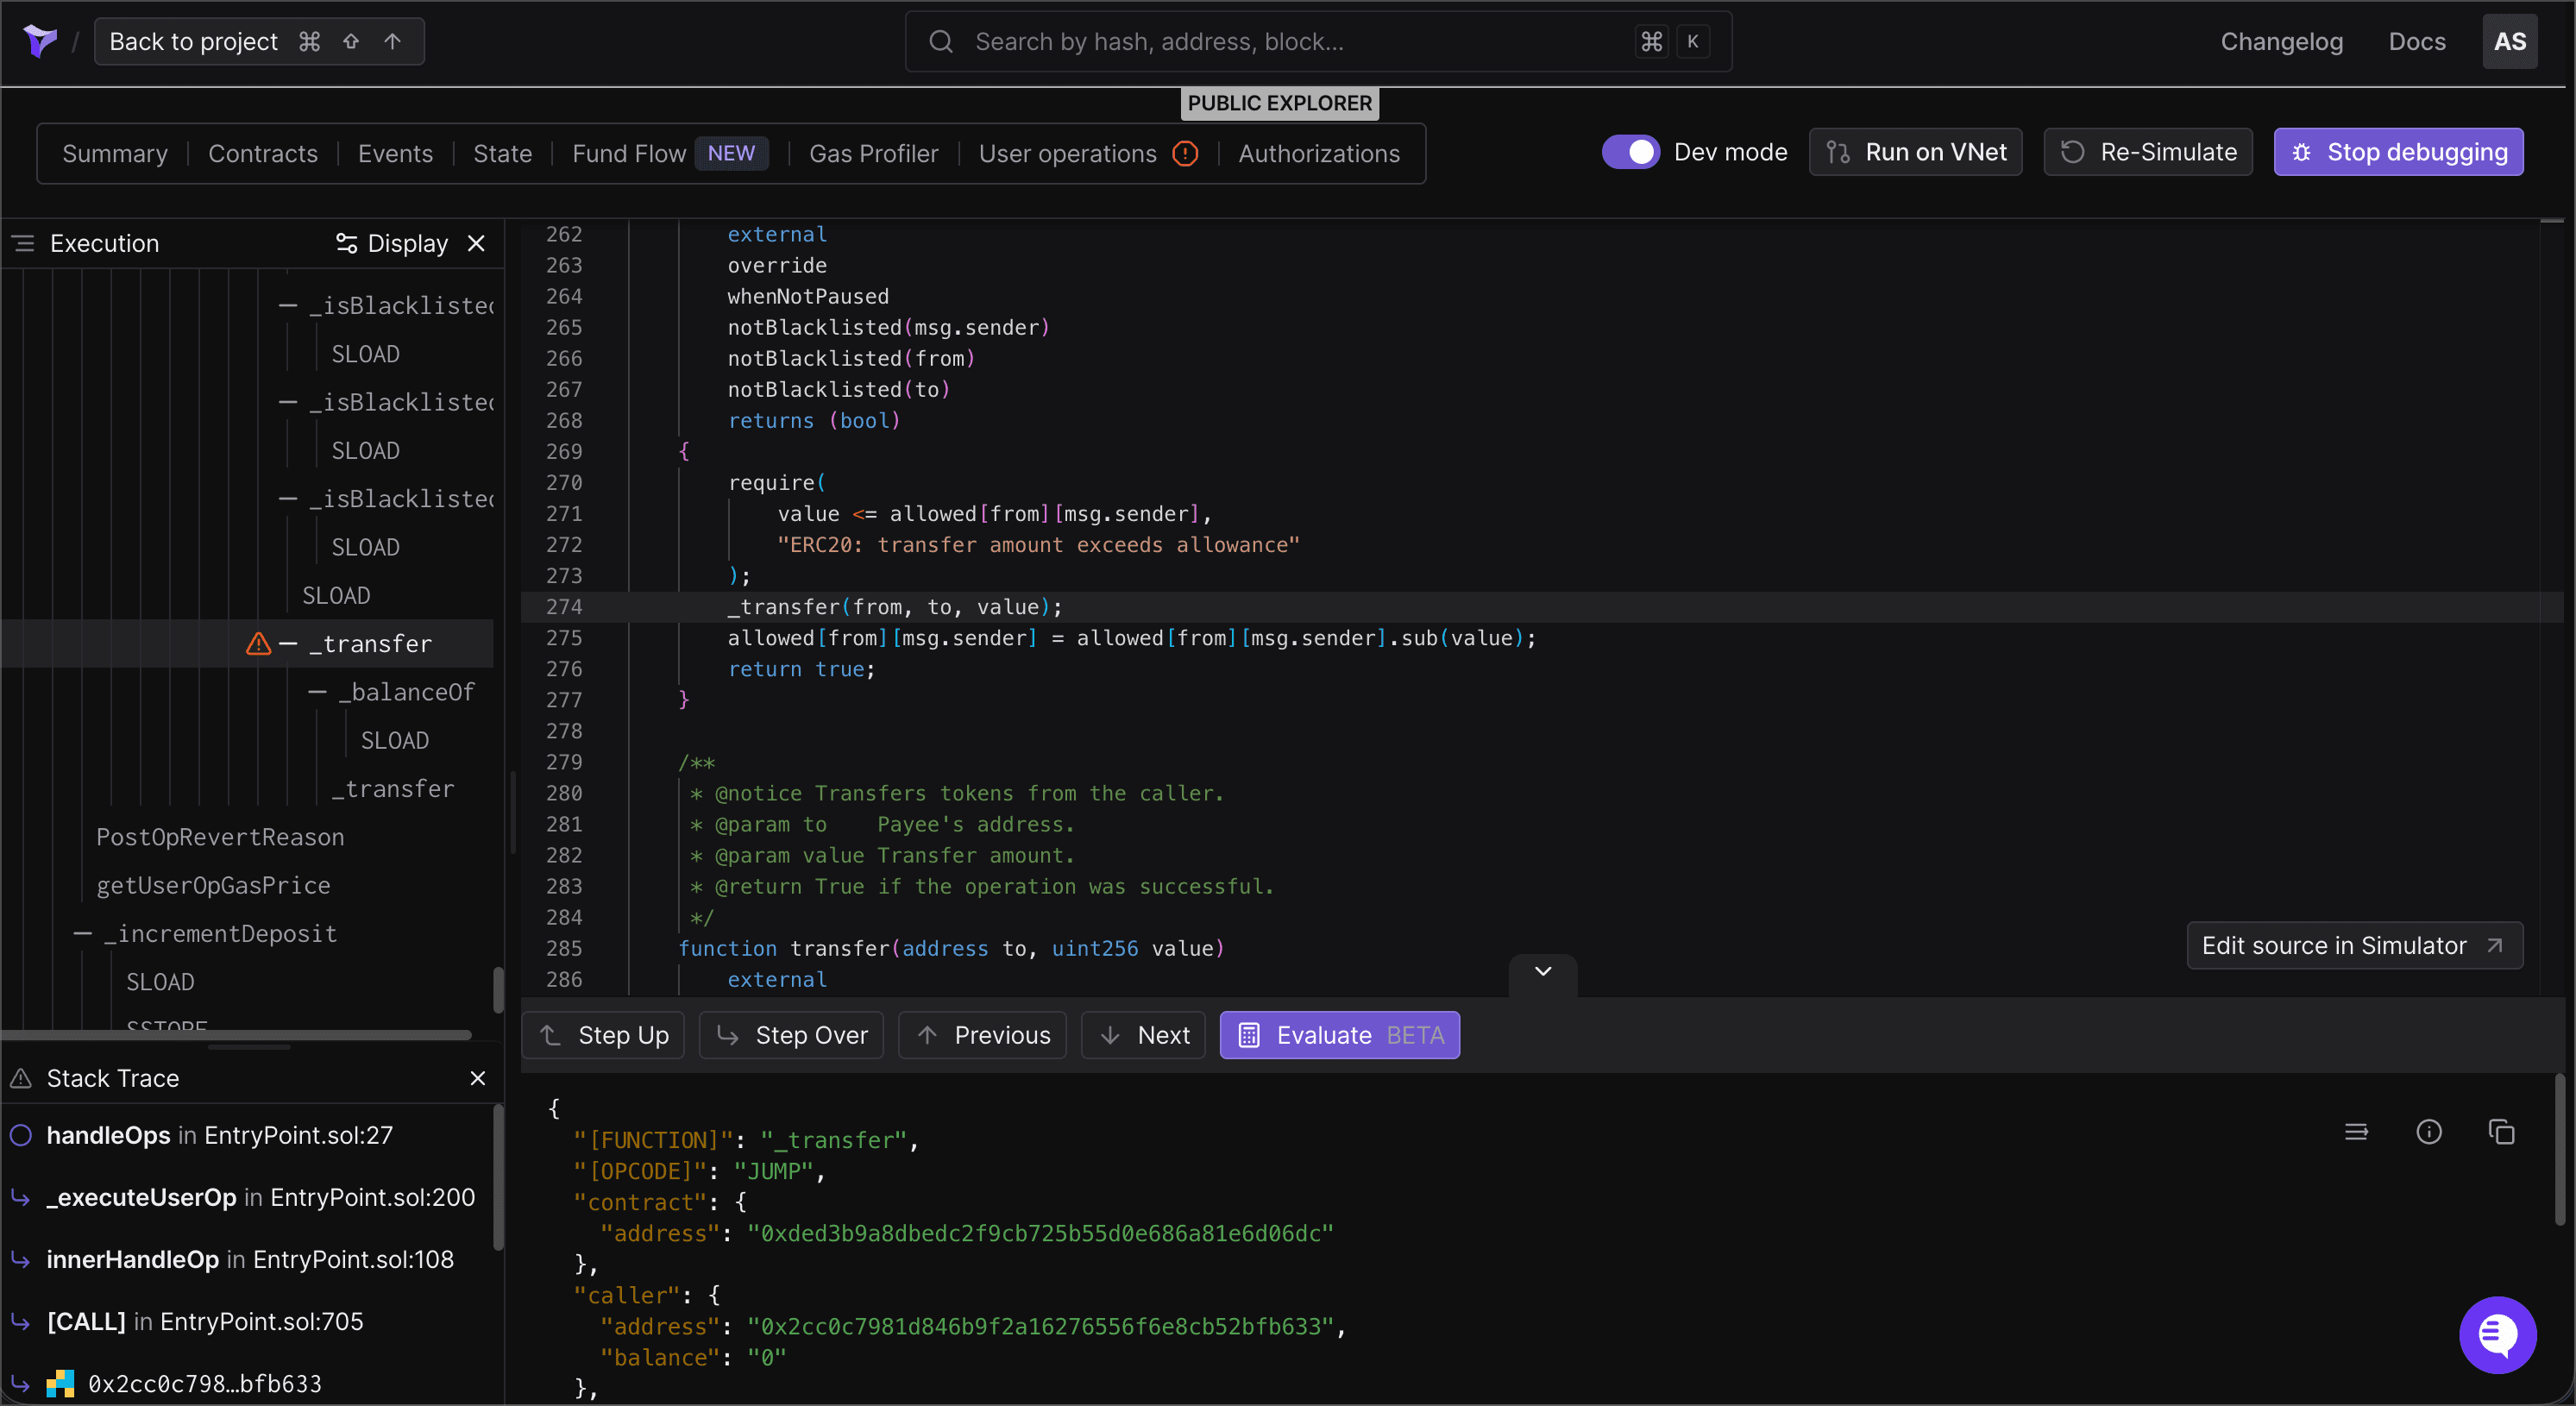
See the Tenderly Debugger documentation for a full guide on navigating the execution trace and evaluating expressions.
When a wallet_sendPreparedCalls call fails before reaching the network (the bundler or EntryPoint rejects the user operation), the Simulate button appears instead. This covers cases where the error is a UserOperationExecutionError and no transaction hash exists.
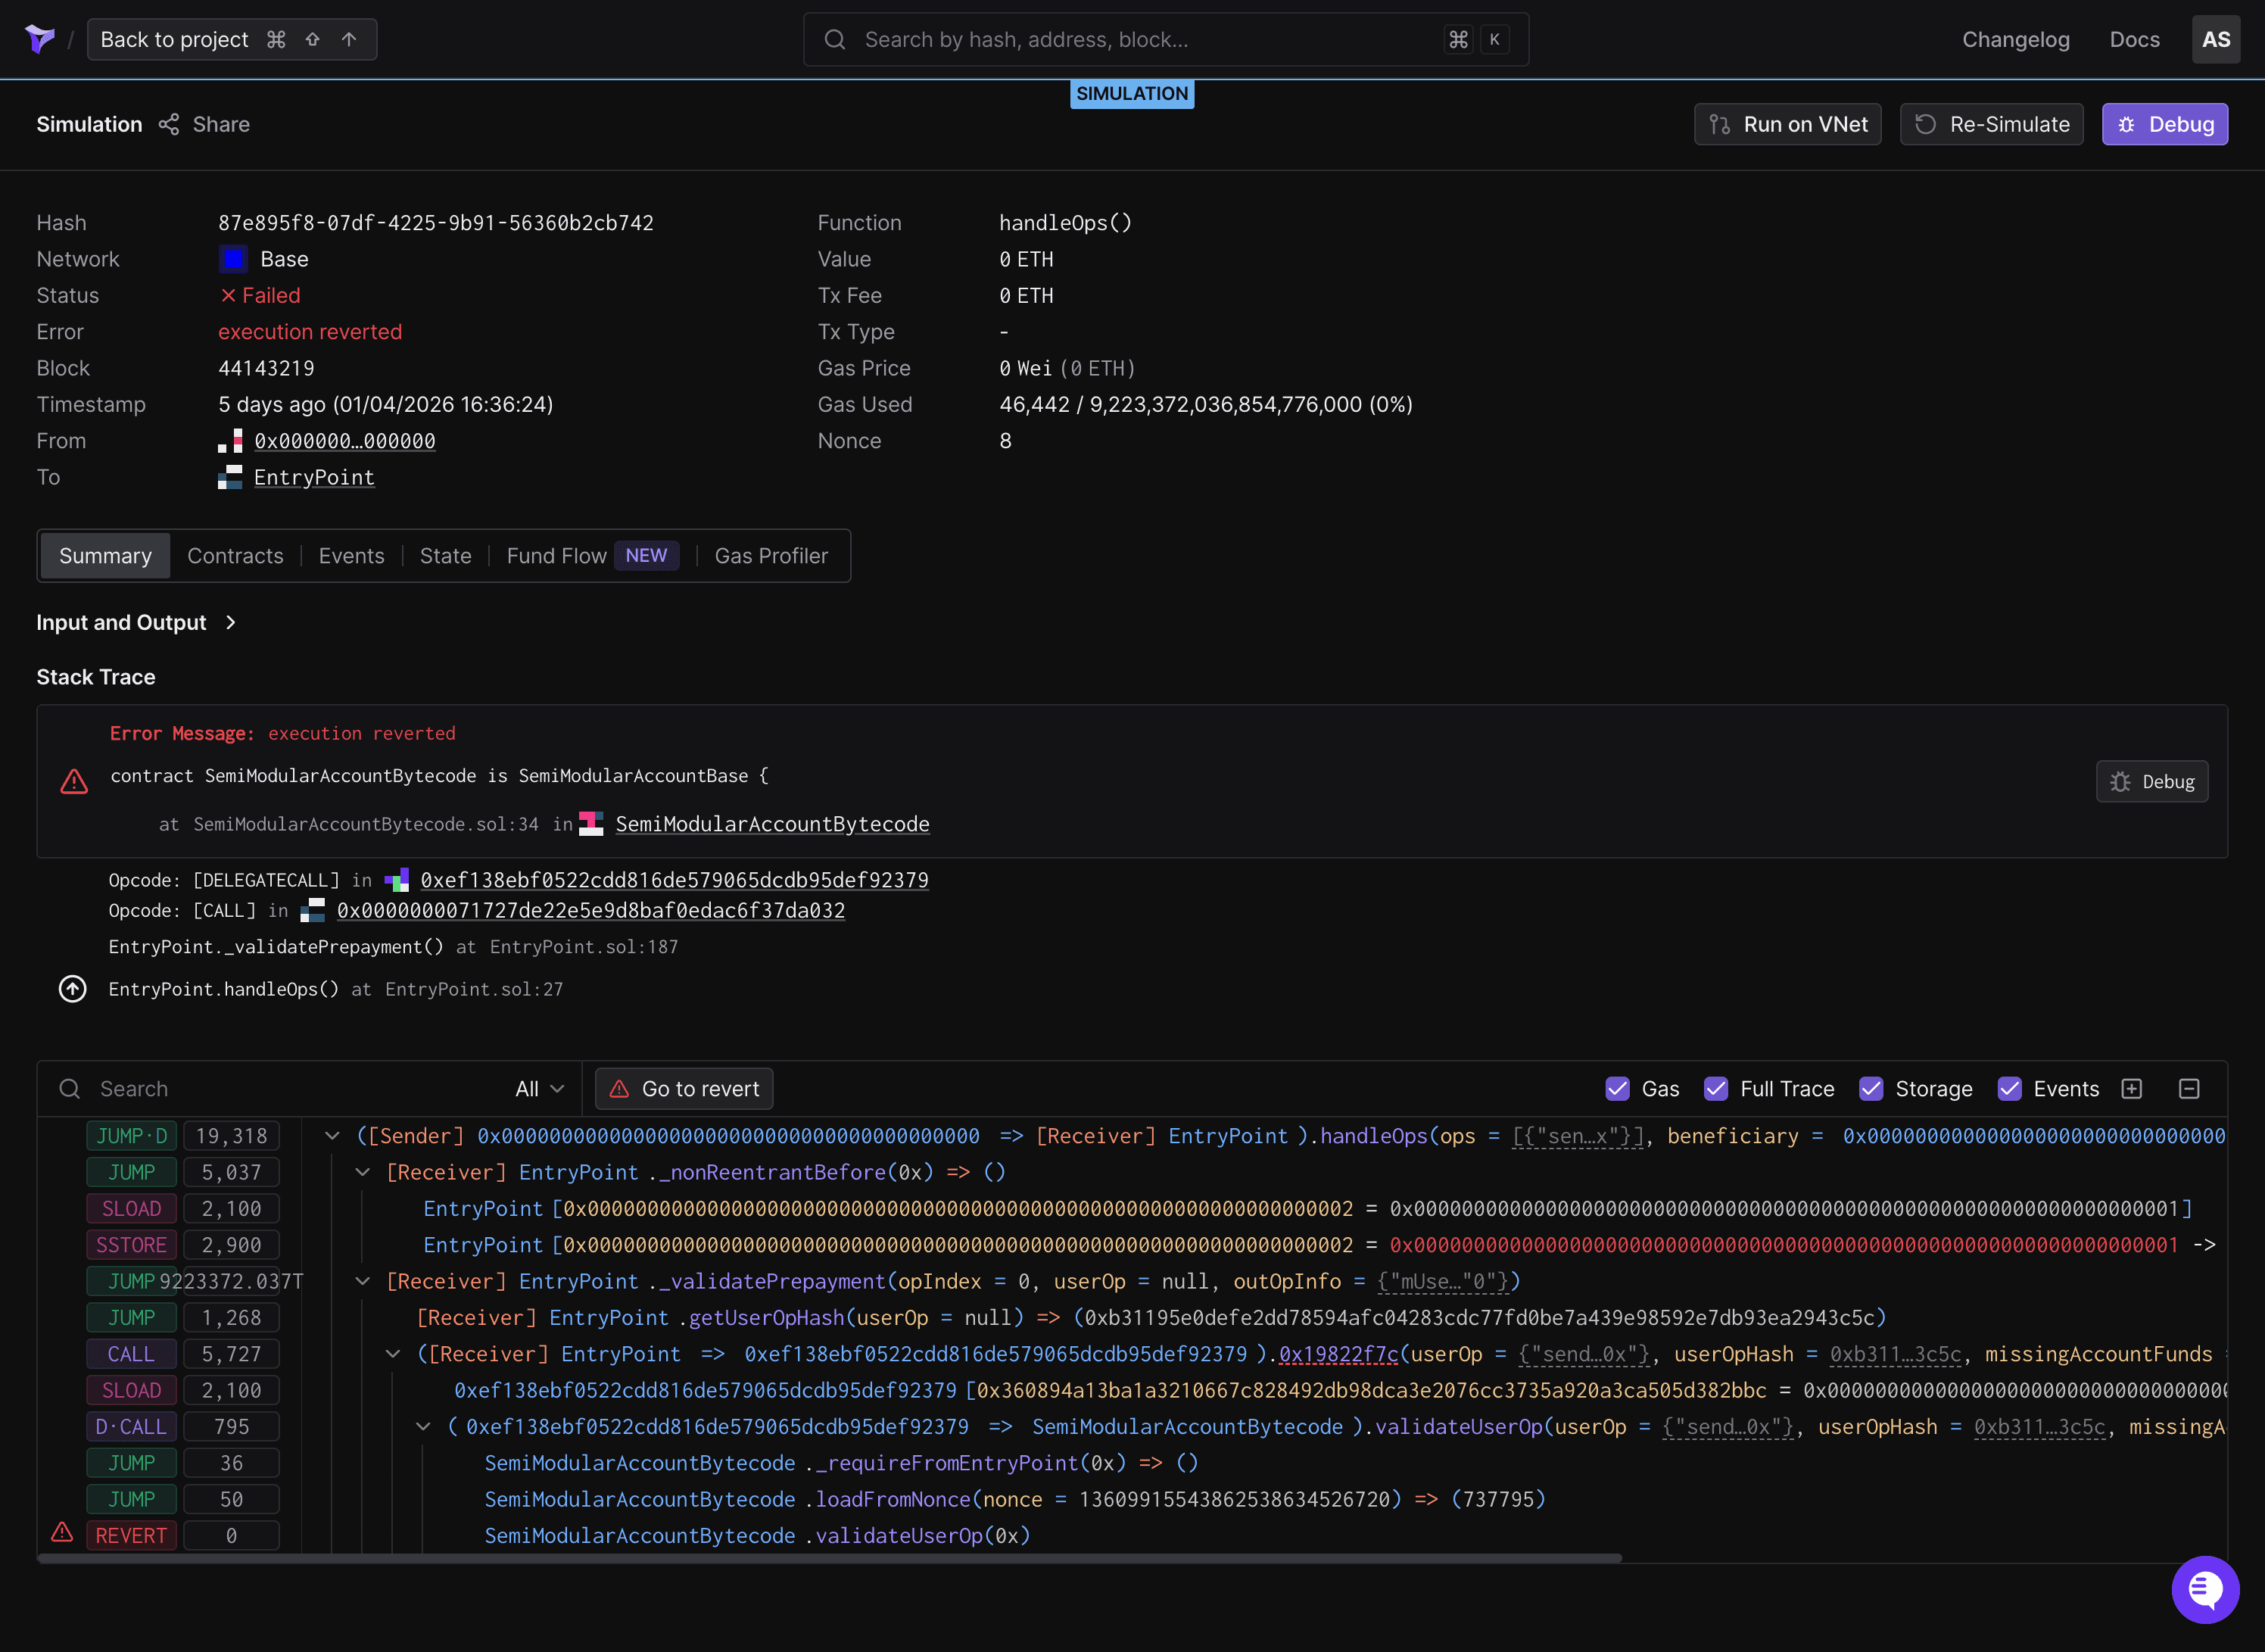
The simulation reconstructs the handleOps call that would have been submitted to the EntryPoint and runs it through Tenderly's simulation engine. This produces a full execution trace as if the transaction had been mined, allowing you to inspect what would have happened onchain.
- The error contains opaque revert data (e.g.,
0x7939f424) instead of a human-readable reason — the simulation decodes the full execution trace and identifies which contract emitted the error. - The smart account's validation reverted with a generic reason like
AA23 reverted— the simulation shows what happened insidevalidateUserOpso you can pinpoint the failing check. - The error is
execution revertedwith empty revert data (0x) — without a trace, there's no way to tell which call failed or why. The simulation reconstructs the execution and reveals the root cause.
Open the Transaction Lifecycle Dashboard and filter by Send Failed status. Select the failed transaction to open the detail panel.
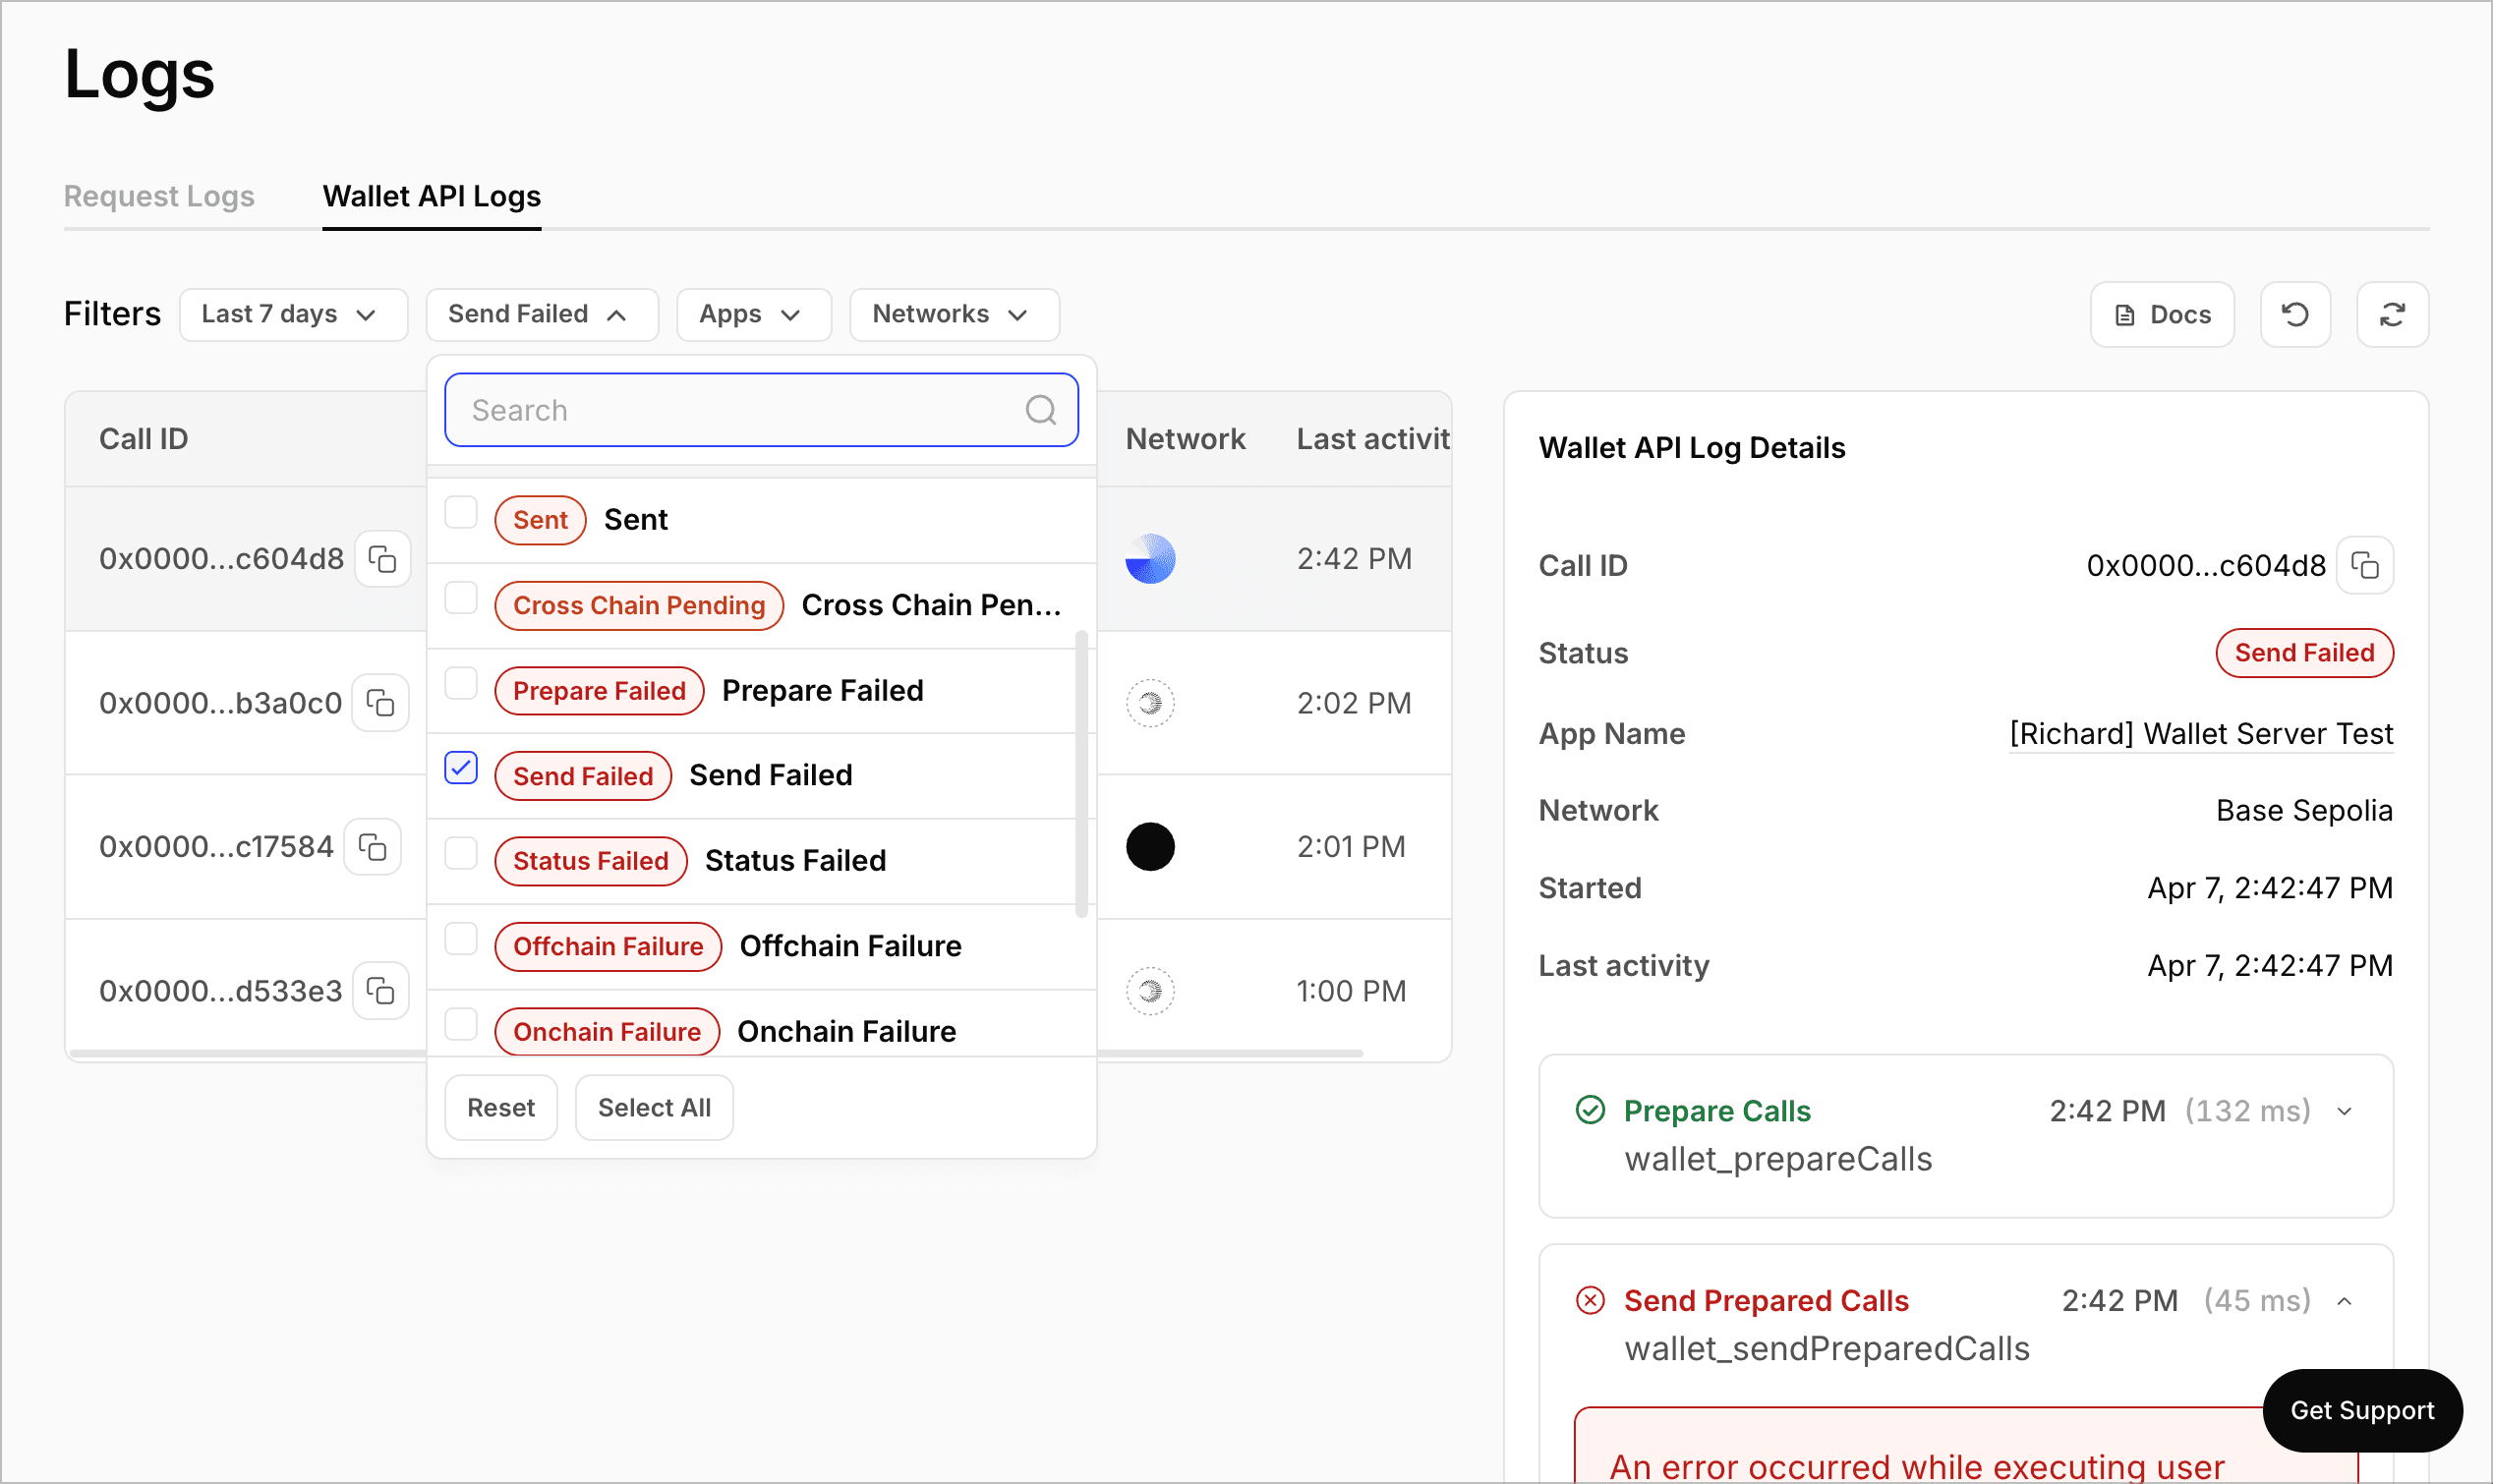
In the detail panel, locate the Simulate button. The button appears on wallet_sendPreparedCalls events with a UserOperationExecutionError on a supported Tenderly network.
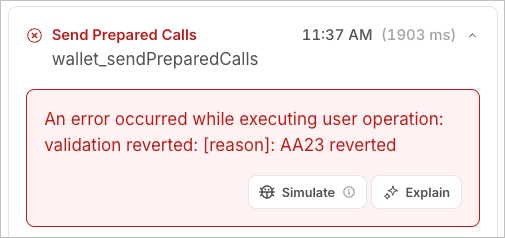
After clicking Simulate, a new browser tab opens while the simulation runs. The simulation typically completes within a few seconds. If the simulation fails or encounters an error, the tab closes automatically and an error message appears below the button.
Once the simulation completes, the new tab redirects to a shared Tenderly simulation page. From there you can:
- View the execution trace showing every internal call, delegate call, and revert
- Check decoded inputs and outputs for each call frame
- Examine state changes to see what storage writes the transaction would have made
- Review the gas breakdown to understand where gas was consumed
See the Tenderly Simulator UI documentation for a full guide on interpreting simulation results.
The Debug and Simulate buttons are available on networks supported by both Alchemy and Tenderly. If the transaction occurred on an unsupported network, the buttons do not appear.
| Network | Mainnet | Testnet |
|---|---|---|
| Ethereum | Ethereum Mainnet | Sepolia |
| Polygon | Polygon PoS | Amoy |
| Arbitrum | Arbitrum One | Arbitrum Sepolia |
| Optimism | OP Mainnet | OP Sepolia |
| Base | Base | Base Sepolia |
| Avalanche | Avalanche C-Chain | Fuji |
| BNB Chain | BNB Smart Chain | BNB Testnet |
| Gnosis | Gnosis Chain | - |
| Linea | Linea Mainnet | Linea Sepolia |
| Scroll | Scroll | Scroll Sepolia |
| Blast | Blast | Blast Sepolia |
| zkSync | zkSync Era | zkSync Sepolia |
| Fantom | Fantom Opera | - |
| Polygon zkEVM | Polygon zkEVM | - |
The Debug or Simulate button does not appear
The buttons require: (1) a supported Tenderly network, (2) the correct failure type (onchain revert for Debug, offchain UserOperationExecutionError for Simulate), and (3) an active Alchemy paying tier. If the transaction is on an unsupported network or the failure type does not match, the buttons are hidden. Check the supported networks table and verify the transaction status in the detail panel.
Simulation rate limit reached
Each team is limited to 10 simulations per hour. Cached simulations (same call ID and event timestamp) do not count toward the limit. Wait for the hourly window to reset, or check if the same simulation was already run by another team member.
Simulation failed with an error
If the simulation encounters an unexpected error (e.g., the user operation could not be decoded or the Tenderly API returned an error), a "Simulation failed. Try again." message appears below the button. Try clicking Simulate again. If the error persists, check that the request payload in the transaction detail panel contains a valid user operation.
Tenderly debugger requires login
The shared simulation link is publicly accessible without a Tenderly account. The full Tenderly transaction debugger (used by the Debug button for onchain failures) requires a free Tenderly account. Sign up at dashboard.tenderly.co/register.
- Debug transactions: Overview of the Transaction Lifecycle Dashboard and AI error explanations
- Send transactions: How to send Wallet API transactions
- Common errors: Reference for frequently encountered issues
- Tenderly Debugger documentation: Full guide on using the Tenderly transaction debugger
- Tenderly Simulator UI documentation: Full guide on running and interpreting transaction simulations