Which RPC provider should you build on in Tokyo?
Author: Alchemy
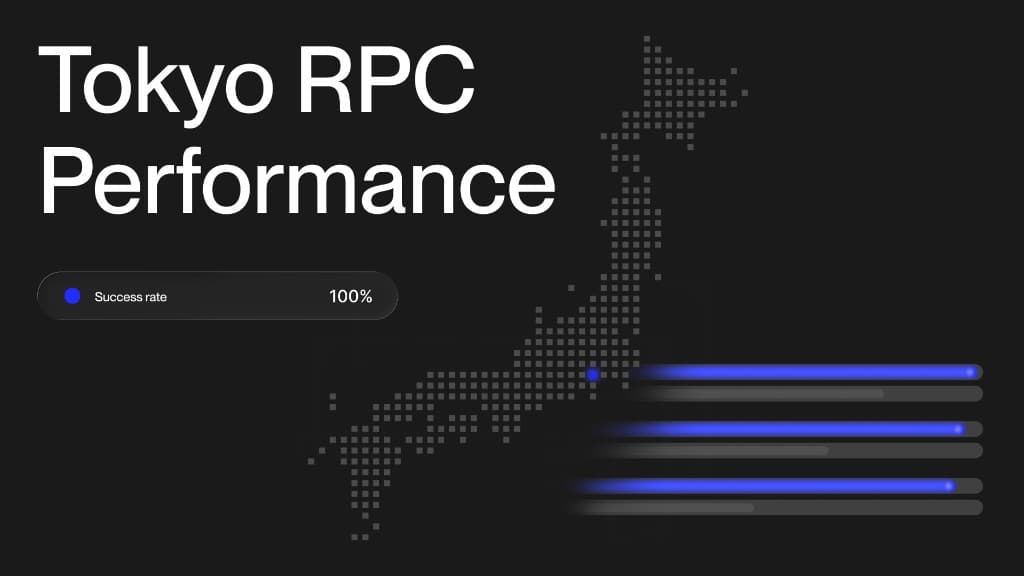
We benchmarked five of the RPC providers serving Tokyo across five chains. Here is how they compare, and where the differences matter for latency-sensitive teams.
Alchemy Node RPC and WebSockets are now live in Tokyo, up to 8x faster than before. Teams building in Japan have a real choice of providers, so we tested them head to head from inside Tokyo, on Ethereum, Arbitrum, BNB Chain, Polygon, and Robinhood Chain, to help you decide which provider to build on.
No provider leads everywhere. What matters for latency-sensitive workflows is finding the provider that fits your use case, on both typical responses and the slowest ones at the tail. For traders, a read that comes back late means a stale price and slippage when the market moves.
How does tail latency compare across chains?
We're the only provider in the top two on all five chains, and first on Polygon, BNB Chain, and Arbitrum.
Here is the p95, the slow end of each provider's responses, by chain.
The widest gap is on Polygon. There, one request in twenty takes longer than 215 ms on QuickNode, against 44 ms for us. Most of that gap comes from state reads. QuickNode's eth_call and eth_getBalance both take more than 215 ms at p95, against 13 ms and 11 ms on ours, and those are the calls trading systems use to update quotes and prices.
Against the rest of the field, the gaps are wider. Our p95 is lower than dRPC, Infura, and Goldsky on every chain we tested them on, by 1.5x on Robinhood Chain and up to 19x on Arbitrum.
In this run, Alchemy and QuickNode both held a 100% success rate on every chain, except QuickNode at 99.96% on Polygon.
How do the providers compare globally?
In our live global benchmark across EVM chains, Alchemy has the lowest average latency of any provider, at 15.54 ms.
Live snapshot from alchemy.com/benchmarks, Sep 29, 2026, 19:22 UTC. Numbers refresh every five minutes and we're adding Tokyo soon for live views of performance; raw data at alchemy.com/benchmarks/data.md. View the methodology here.
How we ran this
One setup, applied to every provider. We sent the same EVM JSON-RPC read requests from controlled AWS ECS instances in Tokyo, on standard paid accounts, with the same warm-up for each. Providers ran one at a time at a steady 20 requests per second.
The requests covered seven common reads: eth_blockNumber, eth_getBalance, a light eth_call (an ERC-20 balanceOf()), eth_getBlockByNumber, eth_getLogs over a 10-block range, eth_getBlockReceipts, and eth_getTransactionReceipt.
Each request got one attempt, with no retries. A retry can hide a slow or failed response, so every slow answer counts against the provider that gave it. The p95 result comes from tracking p95 latency from successful responses only, with failures reported separately.
How to test the RPC that fits your application
Our results are a starting point. The provider that fits your application is the one that holds up on your chains, your methods, and the regions your users or systems are in. You can test that yourself with one script and a few paid endpoints.
1. Test the calls your users feel. For example, if you're building a trading application on an EVM chain test calls like eth_call for quotes and pool state, and eth_getBlockByNumber to get the latest information.
2. Keep everything the same. Send the identical payload to every provider, from the same machine, in the region your app runs. Use the same paid accounts, the same warm-up, reused connections, the same timeout, and one attempt per request with no retries. Benchmark each chain separately, since a result on one chain does not carry over to another.
3. Run long enough to see the tail. To trust p95, collect several thousand requests per provider on each chain, at different times of day. Test providers at your typical production RPS to see how they perform under real load.
4. Read four numbers together.
- Average and p50 for the typical request
- p95 for the slow end, where most stale prices and slippage come from
- Success rate, counting timeouts, rate limits, and errors as failures, and keeping failed requests out of the latency numbers
- Results by method, since a provider can lead on one call and trail on another
For trading workloads, also measure how quickly each provider delivers new blocks.
Start building in Tokyo
Talk to our team about your chains and methods, or start in the dashboard.
Frequently asked questions
Is Alchemy faster than QuickNode in Tokyo?
It depends on your workload. On Polygon, Alchemy is about 17x faster than QuickNode at p95 on a contract or balance read (eth_call and eth_getBalance). At p95, the slow end, Alchemy is nearly 5x faster on Polygon and 1.6x faster on BNB Chain. On Ethereum, Arbitrum, and Robinhood Chain, the two are within about 5 ms of each other at p95, so test the chains and calls your workload depends on.
How can I use Alchemy's Tokyo infrastructure? Do I need to change my endpoint?
Use your Alchemy endpoint. No configuration is required. We route requests automatically to the closest available region.
Which networks are served from Tokyo?
Alchemy's Tokyo infrastructure launches with Base, BNB Chain, Robinhood Chain, Ethereum, Polygon, Arbitrum, HyperEVM, Arc, and more. Alchemy has built 100+ chain relationships over almost 10 years, and we're adding more networks to Tokyo on a rolling basis.
Alchemy Newsletter
Be the first to know about releases
Sign up for our newsletter
Get the latest product updates and resources from Alchemy
By entering your email address, you agree to receive our marketing communications and product updates. You acknowledge that Alchemy processes the information we receive in accordance with our Privacy Notice. You can unsubscribe anytime.

Related articles
Architecting Solana RPC reads for industry-leading speed and reliability
Alchemy has the lowest Solana read latency: 9.21 ms, about 26% faster than the next provider.
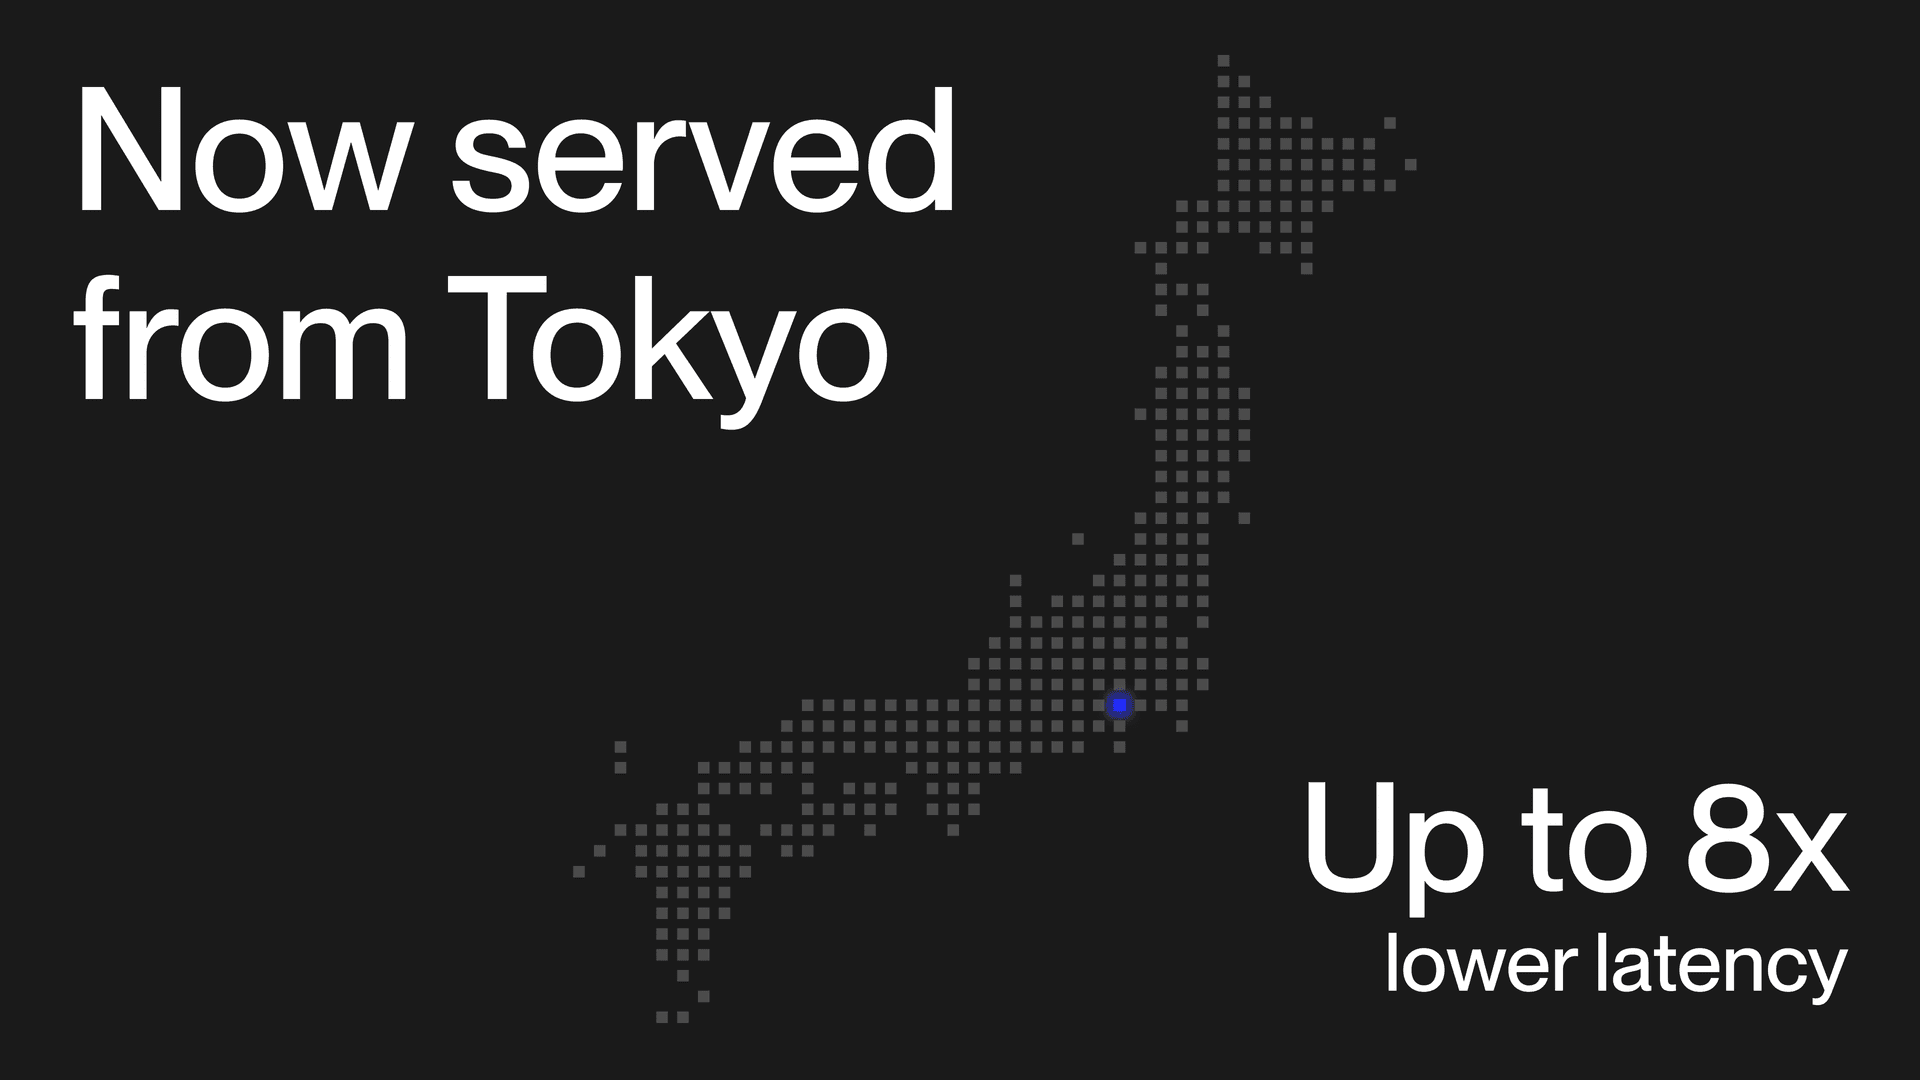
Alchemy launches Tokyo regional support
Node RPC, WebSockets, and Dedicated Clusters are now live in Tokyo, with up to 8x lower median latency for requests from Japan.
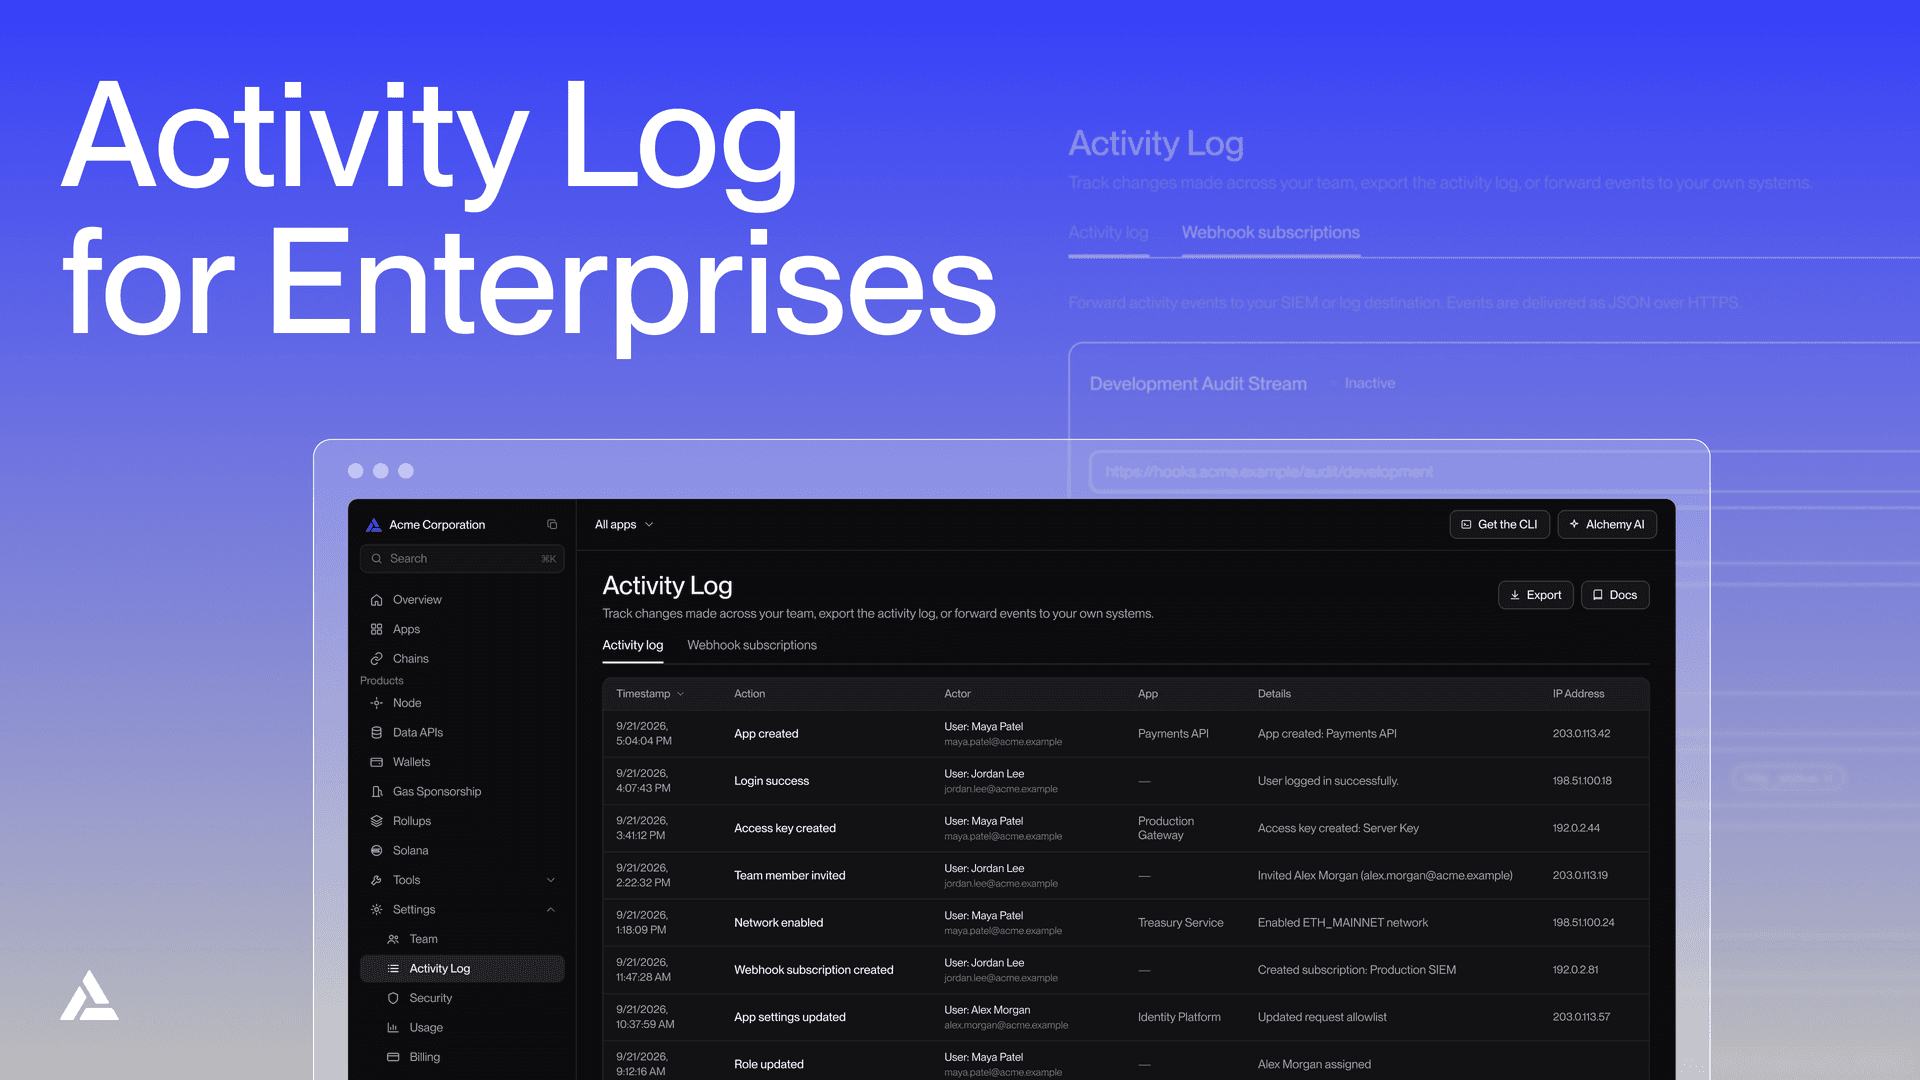
Introducing Activity Log for Enterprises
Activity Log is now available for enterprise teams. Review account changes in the dashboard, or send them to your SIEM.