
Cryptobubblemap
Cryptobubblemap is an interactive bubble chart that visualizes market cap and price changes for over 1,000 cryptocurrencies.




What is Cryptobubblemap?
Cryptobubblemap shows cryptocurrencies as bubbles, with size reflecting market cap or volume and color showing price change over a selected timeframe. It covers more than 1,000 assets and links each bubble to a coin page with price and market details. Market data is sourced from CoinGecko. It also has coin, exchange, and tool pages and runs in the browser without an account.
Web3 dapps and developer tools related to Cryptobubblemap
Discover blockchain applications that are frequently used with Cryptobubblemap.
 Nansen Portfolio


 Datai

 The Crypto App


 Lighthouse

Developer resources from Alchemy
Solana archival data: how to query full block and transaction history
Solana archival data explained: why nodes prune history, which RPC methods need archival access, and how to query full block and transaction history at scale.

How to build Solana AI agents in 2026
A technical tutorial showing you how to build agents on Solana.
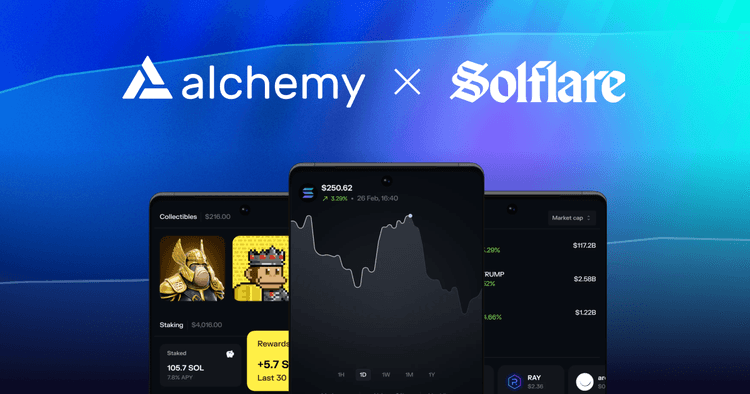
How Solflare delivers fast, reliable Solana analytics to 4M+ users
Learn how Solflare powers advanced Solana analytics for 4M+ users using Alchemy’s high-performance Solana Archive Method for fast, reliable historical data.
Cryptobubblemap alternatives
Explore web3 competitors and apps like Cryptobubblemap.
 LOCKON
 DEX Screener
 Agentic Finance Graph
 PMWallets
App store listings are independently reviewed and written by Alchemy using a combination of inbound submissions, editorial research, public project sources, and third-party directories, including ecosystem data from The Grid under the Open Database License, DefiLlama, DappRadar, Reown, and chain ecosystem pages.